
With climate change high on the global agenda and a mounting awareness of how everything, from the transport we use to the way we heat our homes, is impacting the planet, many areas of the UK economy are striving to become more green. One sector in which this is most noticeable is the UK’s transport industry.
Both the manufacturing and sales of electric vehicles (EVs) are on the rise in the UK, and with the government currently in consultation to bring the deadline for the end of sales of new combustion engine vehicles forward from 2040 to 2035 (or possibly even 2030), habits, norms and even infrastructure all over the UK are beginning to change and adapt.
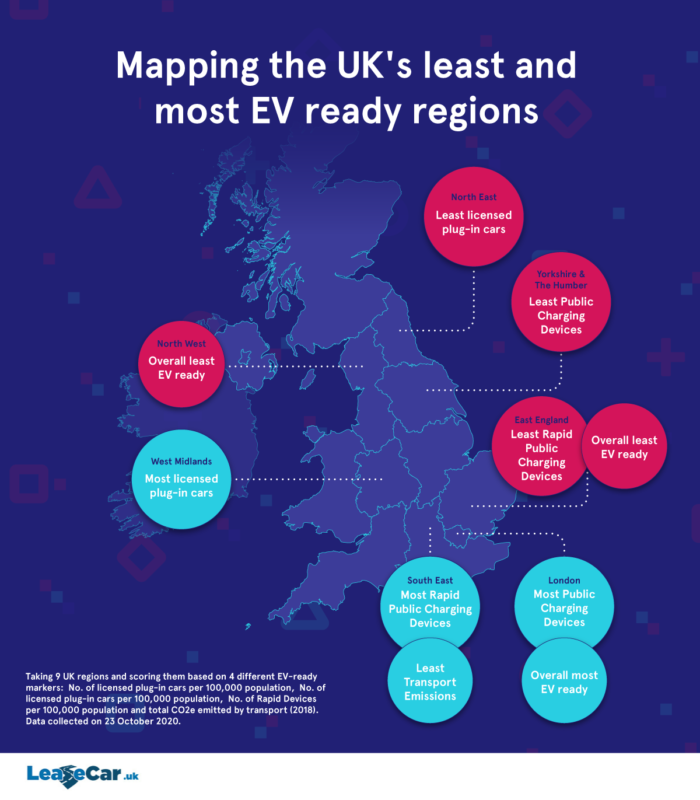
Here at Lease Car, we wanted to know which areas of the UK are currently most EV-friendly and which still have some way to go to get ready for the EV revolution. To do this we created a unique scoring system that rates different regions of the UK on four key criteria, before creating a final Great British EV League Table.
Methodology: how does the scoring system work?
In order to create a league table that is fair and produces interesting and useful results, a unique scoring system is required. Looking at four key EV-friendly criteria – the number of licensed EV cars in the region per 100,000 people, the number of rapid charging devices in the region per 100,000 people, the number of regular charging devices in the region per 100,000 people, and the total CO2e (carbon dioxide equivalent) caused by transport in each region in 2018 – we award the highest score to the region deemed to be most EV-friendly in each criteria and the lowest score to the region deemed to be the least EV-friendly, with 1 being the lowest point tally and 9 being the highest. The total of all four criteria scores provides the region’s final tally and allows us to rank each region from most to least EV-friendly.
To award each region with a score in each criterion, we used the latest data provided by the Department for Business, Energy & Industrial Strategy for UK local authority and regional carbon dioxide emissions national statistics: 2005 to 2018, the Office for National Statistics (ONS) for the estimates of the population for each region, and the ONS figures for the number of electric vehicle charging devices by local authority.
Here’s what we found…
The final standings
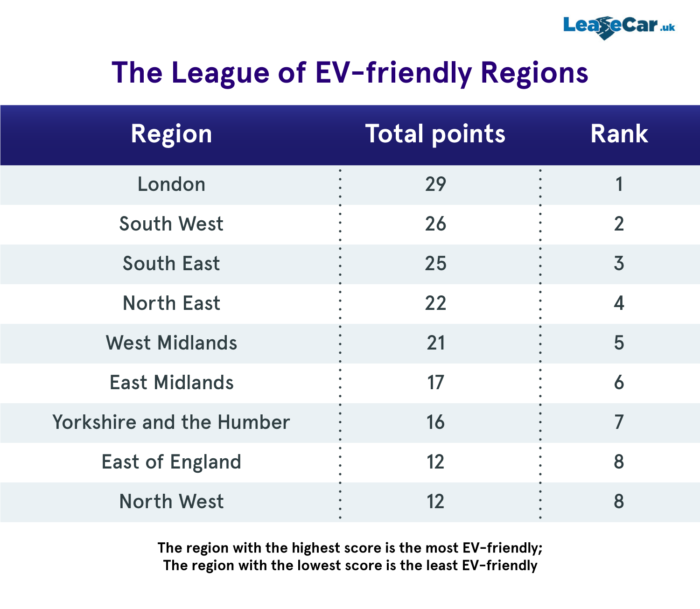
Overall, when all the points are totted up and the regions are ranked accordingly, the London region comes out on top as the most EV-ready area in the UK with 29 points. Although not achieving full marks in all criteria, the capital performed fairly consistently in all areas and is worthy of the current title of ‘most EV-friendly region in the UK’. The South West and South East also fared well, finishing second and third respectively, meaning they are also preparing well for a boom in the sale of plug-in vehicles. However, finishing joint bottom of the pile with just 8 points apiece, the East of England and the North West seemingly still have some way to go before they can be considered EV-friendly regions.
The breakdown…
Number of licensed plug-in cars in each region
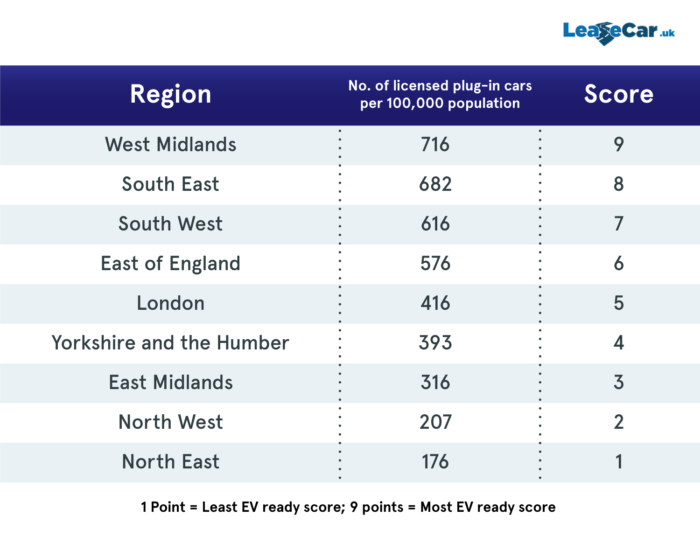
With an impressive 716 licensed plug-in vehicles per 100,000 people, the West Midlands is by some distance the region of the UK that has seen the highest uptake of EVs. As the former epicentre of Britain’s car manufacturing industry, this should maybe come as little surprise.
The London area sits mid-table with 5 points thanks to their 416 licensed plug-in vehicles per 100,000 people. However, lagging way behind the national trend as EVs become more common, the North East of England is cut adrift at the bottom of the table with only 176 licensed EVs per 100,000 people.
Number of rapid charging devices in each region
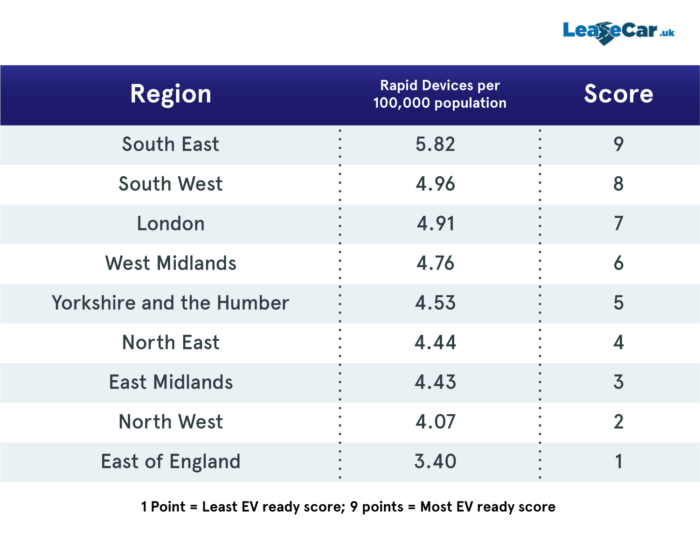
Despite boasting the largest number of licensed EVs for its population, the West Midlands only picks up 6 points when it comes to the number of rapid charging devices available for public use in the region. The South East claims top spot in this criterion and is awarded 9 points thanks to its (still fairly modest) 5.82 devices per 100,000 population. The North East sits in the middle of the table, with its 4.44 rapid devices per 100,000 people, perhaps mirroring its low number of licensed EVs, while the East of England only picks up 1 point due to its low 3.4 rapid devices per 100,000 people.
Number of regular charging devices per 100,000 population in each region
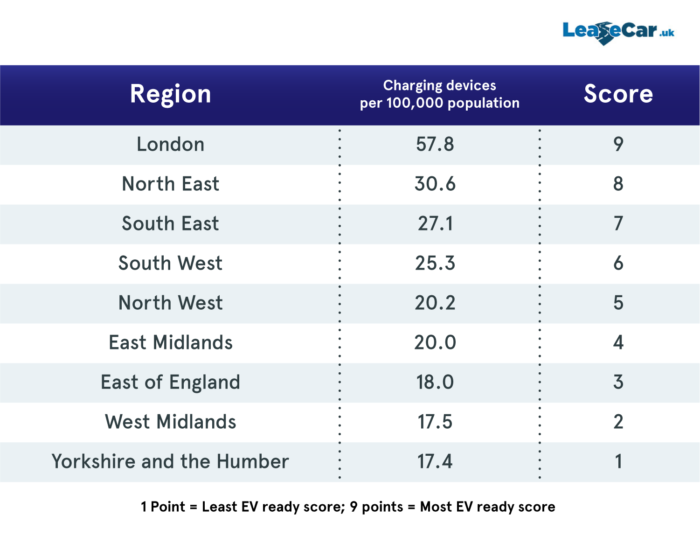
When it comes to regular charging points, it appears London is most EV-ready. The capital scores full marks thanks to their impressive 57.8 regular charging devices per 100,000 population. This is more than double the UK average, which sits at 27.5 devices. Despite having the lowest number of licensed EVs on the road in the UK, the North East actually boasts the second highest number of charging devices when compared to its population, which sees it awarded 8 points in this area. Lagging way behind with only 17.4 regular charging stations per 100,000 people, Yorkshire and the Humber only receives a single point in this criterion.
Total CO2e caused by conventional transport
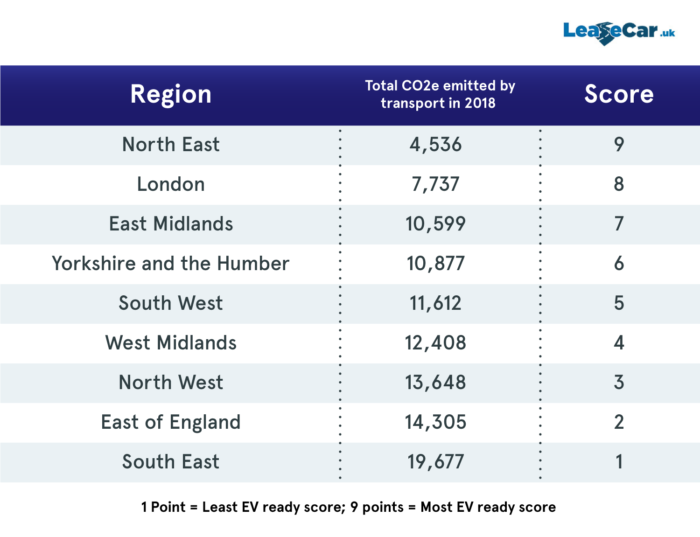
What it lacks in terms of the number of EVs on the road, the North East certainly makes up for in low CO2e transport emission levels, scoring full marks in this area. Perhaps somewhat surprisingly, London also scores well in this criterion, with the second lowest level of transport emissions in 2018. Coming bottom of the table in this area and awarded only 1 point is the South East, which represents the region responsible for the highest levels of transport related CO2e emissions in the entire UK in 2018.
So there you have it! Using a unique scoring system and four key criteria, here at Lease Car we have created the ultimate EV league table for 2020, highlighting the leaders and losers when it comes to EV-friendly regions in the UK. But what do you make of our league table, and how ready do you think your region is when it comes to plug-in vehicles? Let us know by getting in touch on social media using the hashtag #EVLeague.